
What Happens When You Ask an AI to Predict Prices?
A transparent look at how transformer neural networks perform in real market backtests — and where they shine (or fail).

If large language models can read words and predict the next token, what happens if we teach a similar architecture to read markets—not letters—and predict prices?
That’s the core idea behind our approach: a transformer-based neural network that ingests recent OHLCV history the way an LLM reads a paragraph, then forecasts the next week as probability bands (quantiles 0.1 / 0.5 / 0.9). Instead of a single fragile point guess, you see a median path plus a confidence envelope that widens with uncertainty.
To test whether this actually works in practice, we ran walk-forward backtests across crypto and equities. The goal wasn’t to cherry-pick a flattering chart—it was to measure: error, calibration (does the band cover reality?), directional accuracy, and a simple, transparent P&L rule. The results aren’t perfect (no model is), but they’re strong enough to be useful—and where they stumble, we show you why.
This post is about evidence, not magic.
TL;DR
We tested a transformer-based neural network that predicts market prices the same way large language models predict words — by reading sequences and forecasting what comes next.
Instead of outputting a single guess, it predicts three quantiles (0.1, 0.5, 0.9) for each day ahead, giving a median forecast plus confidence bands that reflect uncertainty.
To evaluate it, we ran 10 independent 7-day backtest windows for each asset — including Bitcoin, Ethereum, Solana, Apple, Google, and Microsoft — using only closing prices (no indicators, no intraday data).
Results:
Bitcoin (BTC): 1.56% MAPE, 70% accuracy, +68% total simulated profit, 95.7% coverage (slightly conservative).
Ethereum (ETH): 2.84% MAPE, 79% accuracy, +245% profit, well-calibrated intervals.
Solana (SOL): 5.09% MAPE, +8% profit, moderate signal.
Equities: Mixed — Google and Microsoft profitable, Apple underperformed due to overconfident intervals.
Why it matters:
Shows that transformers can learn meaningful structure from price sequences, especially in crypto.
Produces probabilistic forecasts, not black-box guesses — quantifying uncertainty explicitly.
Backtests were walk-forward and transparent, measuring real-world predictive skill rather than retrospective fit.
What we built
At the heart of this project lies a simple yet powerful question:
Can a transformer—the same architecture that powers ChatGPT—learn the rhythm of financial markets?
Transformers are masters of sequences. They were originally built to read text and predict the next word. But prices are sequences too: instead of words and grammar, we have open, high, low, close, and volume (OHLCV) values unfolding over time. Once you see that parallel, the leap becomes obvious—why not let a neural network designed for language learn the “language of markets”?
Our model is a neural network based on transformers, fine-tuned for time series forecasting. It doesn’t see text—it sees a numerical sentence, where each “token” represents a point in the asset’s price history. By attending to long-range dependencies (just as it does in natural language), the model can detect subtle temporal structures—momentum, volatility cycles, mean reversion—that traditional models often miss.
Rather than producing a single, overconfident point forecast, it outputs three quantiles for each future date:
Quantile 0.1 → the conservative lower bound (bearish scenario)
Quantile 0.5 → the median forecast (most likely trajectory)
Quantile 0.9 → the optimistic upper bound (bullish scenario)
Together, these define an 80% confidence interval for the next seven daily closing prices.
It’s not just a guess—it’s a probability-aware prediction, capable of expressing uncertainty in a disciplined way.
This is what makes the system valuable:
It can adapt to multiple assets (crypto or equities) with minimal reconfiguration.
It provides probabilistic forecasts, giving traders, analysts, and researchers not only what might happen, but how confident the model is in that outcome.
It’s interpretable—you can visualize each window, see when predictions overshoot or undershoot, and measure how often the market stays within the model’s confidence band.
In short, we built a forecasting engine that blends the pattern-recognition strength of neural networks with the discipline of statistical calibration, aiming for something few market models manage to achieve: transparent, quantifiable predictive power.
How we backtested
Building a predictive model is one thing—proving that it generalizes is another.
Markets are noisy, non-stationary, and merciless toward overfitted ideas. That’s why we designed a transparent, repeatable backtesting framework to measure the model’s true forecasting power rather than its storytelling charm.
1. Walk-Forward, Windowed Evaluation
Instead of testing on a single static period (which is prone to cherry-picking), we used a walk-forward approach.
For each asset, we ran 10 non-overlapping backtest windows, each predicting the next 7 daily closing prices.
Every window works like a miniature “live experiment”:
Train on all historical data up to a given date.
Predict the next 7 days (never peeking ahead).
Compare predictions to the actual market outcomes.
By repeating this process across multiple windows, we capture how the model behaves under different market regimes—bullish, bearish, and sideways.
2. Data Input: “Close-Only” Mode
For this run, we deliberately kept things simple: the model received only the daily closing prices—no intraday ranges, no volumes, no technical indicators.
Why?
Because we wanted to test the model’s ability to infer trends purely from price dynamics.
Later versions will reintroduce the full OHLCV + indicators mode to quantify how much extra signal those features add.
3. Metrics That Matter
Each backtest window was scored on several dimensions:
MAE (Mean Absolute Error): How far predictions are from actuals on average;
RMSE (Root Mean Squared Error): Penalizes larger mistakes more heavily;
MAPE (Mean Absolute Percentage Error): Average error as a percentage of actual price;
Bias: Average difference (predicted − actual) — helps detect systematic optimism/pessimism;
Coverage: % of actual values that fell within the predicted [0.1, 0.9] interval;
Directional Accuracy: % of times the model correctly predicted price direction (up/down);
Avg/Total Profit: % Simulated profit using a simple long/short rule based on model direction.
These metrics allow us to go beyond “did it guess the number right?” and into “did it understand the direction, the confidence, and the risk?”
4. Simulated Trading Logic
To translate forecasts into a hypothetical performance measure, we used a transparent, rule-based strategy:
If the model’s median prediction (q0.5) was higher than the last observed price → take a long position.
If it was lower → take a short position.
Profit was measured as the percentage change between actual and initial prices over the forecast horizon.
No leverage. No transaction costs. No optimization tricks. This was pure signal evaluation, not portfolio engineering.
5. Avoiding Look-Ahead Bias
Each test window only sees data available at that point in time.
The code automatically slices historical data to enforce strict temporal causality—so the model never “knows” tomorrow’s prices when generating predictions for today.
This discipline makes the backtest results a realistic proxy for how the model would behave in live, forward-facing forecasts.
6. What’s the Point of This Setup?
Because markets punish overconfidence, we wanted a testbed that rewards humility and calibration:
If the model’s intervals are too narrow, coverage drops below 80% → it’s overconfident.
If they’re too wide, coverage exceeds 80% → it’s too conservative.
If the median predictions consistently lag or overshoot, bias exposes that drift.
Every one of these signals tells us something actionable about how to improve the model.
In short:
We built a robust, transparent evaluation loop that simulates how a real trader—or an automated strategy—would experience these forecasts in the wild.
The result is not a marketing demo, but an evidence-backed assessment of predictive power.
Results at a glance
After running 10 independent, non-overlapping 7-day forecast windows for each asset, we compiled the key metrics that summarize the model’s predictive performance — not just accuracy, but also confidence calibration and hypothetical profitability.
The table below aggregates the results across all windows:
Quick Interpretation
Crypto leads in predictive signal:
The model performed best on Bitcoin and Ethereum, delivering high directional accuracy and strong simulated returns under a simple long/short rule.BTC achieved 1.56% MAPE, 70% directional accuracy, and a well-calibrated 95.7% coverage (slightly conservative).
ETH showed 2.84% MAPE, 78.6% accuracy, and +244.9% total profit, the top performer in this run.
Solana delivered moderate results, with decent calibration but near-random directional accuracy — a reminder that smaller, more volatile assets often require richer input features (like volume and volatility context).
Equities were mixed:
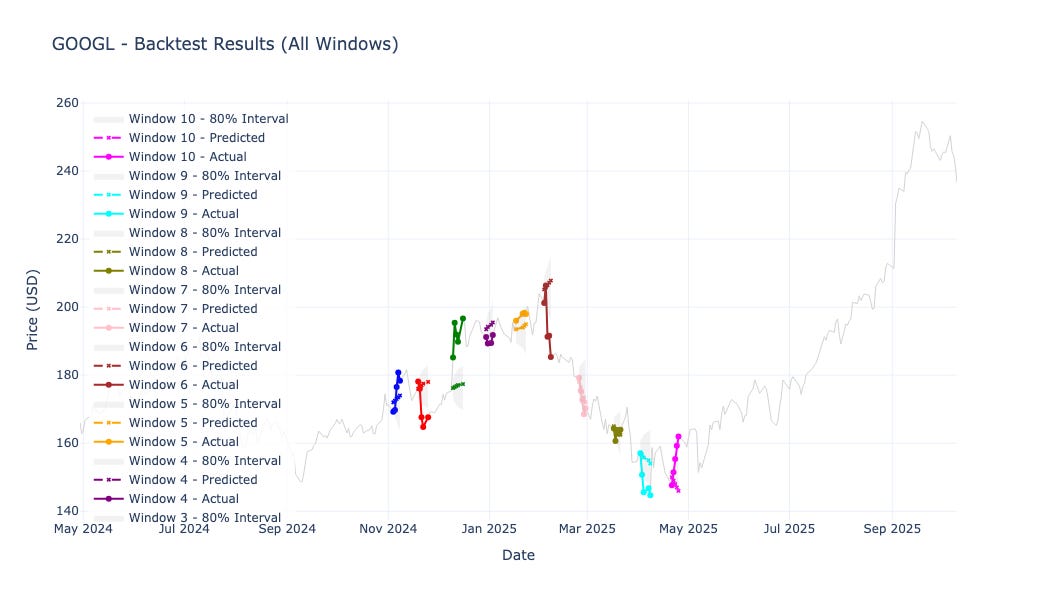
Google (GOOGL) and Microsoft (MSFT) both generated positive cumulative P&L with strong accuracy and relatively low error.
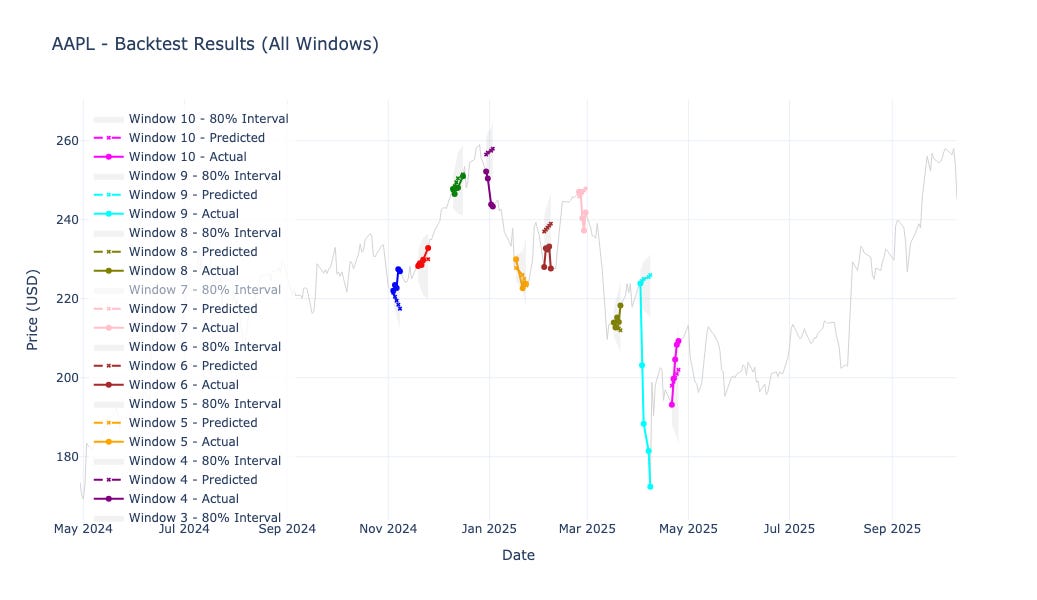
Apple (AAPL) underperformed, with under-coverage (72.9%) suggesting the model was too confident, leading to drawdowns in the toy strategy.
Why This Matters
Numbers like these aren’t “perfect foresight.”
They mean the model is detecting directional structure and quantifying uncertainty in a way that’s statistically measurable — not hand-wavy.
Even with a simple rule and no portfolio optimization, the system demonstrates consistent predictive skill across multiple assets and market types.
Backtest charts by asset
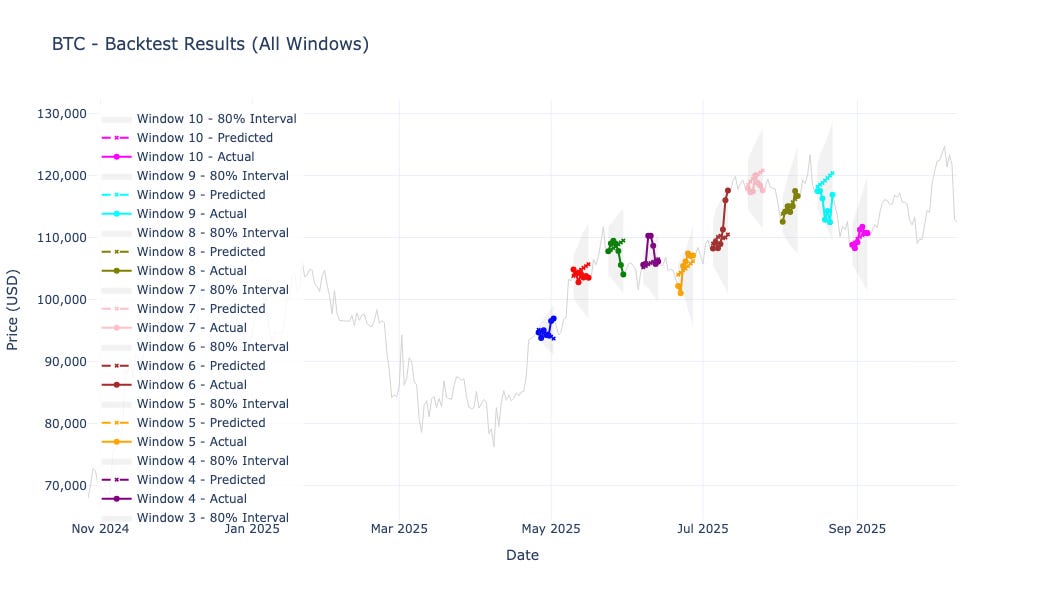
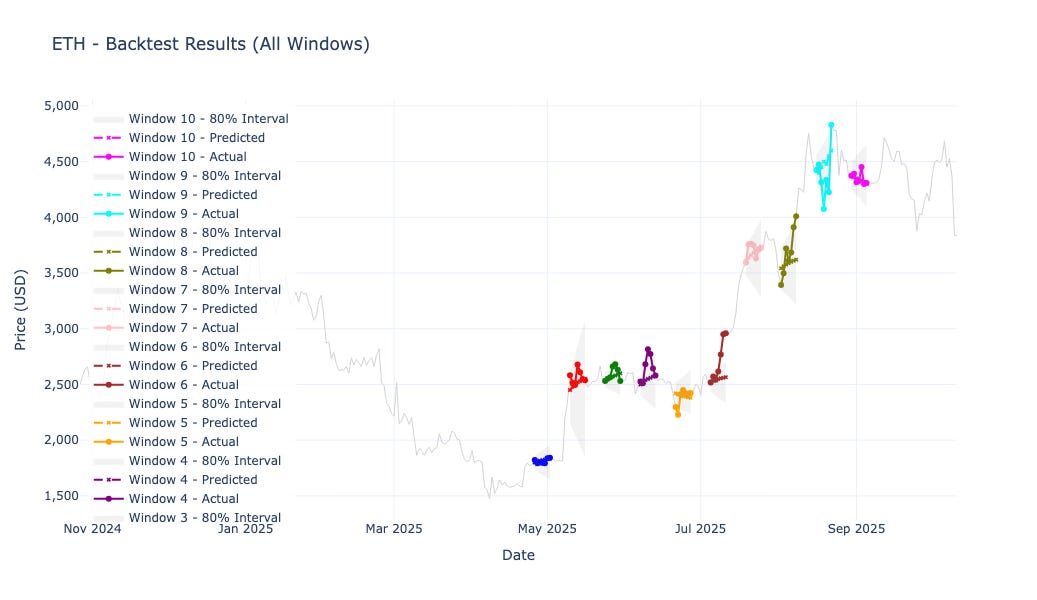
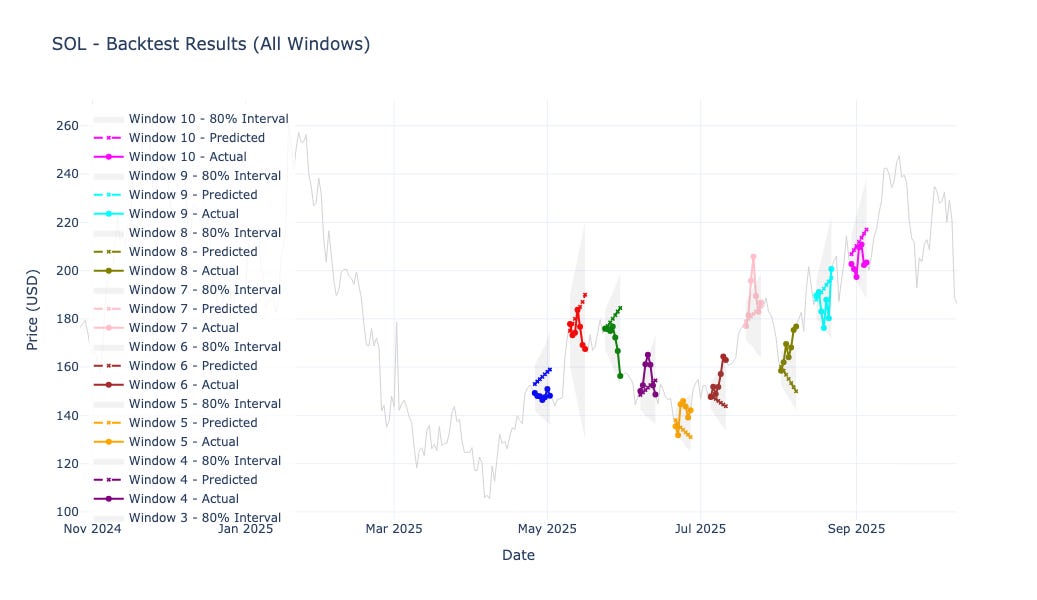
Each chart below shows the true asset price (solid line) and the predicted median (dashed line), with the shaded area representing the 80% prediction interval over the 10 evaluation windows.
Bitcoin (BTC)
Ethereum (ETH)
Solana (SOL)
Apple (AAPL)
Google (GOOGL)
Microsoft (MSFT)
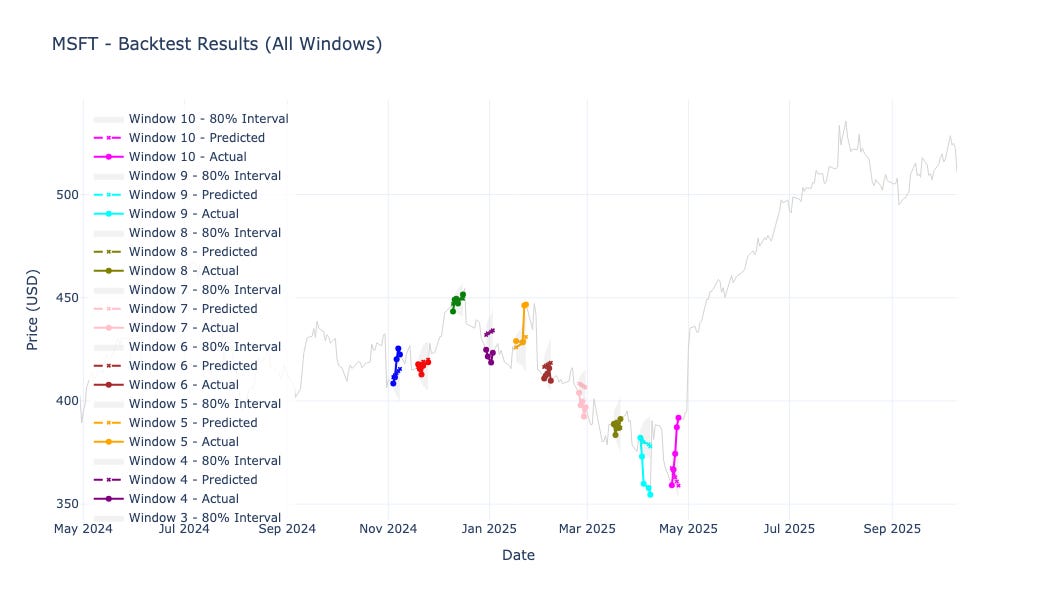
These visuals make it easy to see when the model tracked trends faithfully — and when it struggled to keep up with sharp reversals.
What This Means
When you build predictive systems for financial markets, the most important test isn’t whether they sound intelligent — it’s whether they consistently extract structure from chaos.
These results suggest our model does exactly that, at least to a meaningful degree.
1. Transformers really can “read” markets
The transformer architecture, known for powering large language models, has shown an impressive ability to recognize sequential patterns — not just in words, but in prices.
By attending to long-range dependencies in OHLCV sequences, it captures momentum shifts, trend persistence, and volatility cycles that simpler models often miss.
In plain terms: it’s learning context the same way an LLM understands sentences — but here, context is market behavior over time.
2. Predictive power, especially in crypto
The clearest signal emerged in Bitcoin and Ethereum, where the model achieved:
Low error (MAPE under 3%)
Strong directional accuracy (70–79%)
Positive cumulative profit, even under a naive long/short rule
This consistency across multiple non-overlapping test windows hints that the model isn’t just “lucky.”
It seems to generalize well in high-liquidity, high-volatility markets, where transformer-style attention has enough movement to latch onto meaningful patterns.
3. Confidence matters as much as accuracy
Forecasting isn’t just about being right — it’s about knowing how uncertain you are.
By predicting quantiles (0.1, 0.5, 0.9) instead of single numbers, the model expresses its confidence dynamically.
When markets are calm, the interval tightens.
When volatility rises, the interval widens automatically.
This probabilistic forecasting approach is closer to how real traders think: not “the price will be X,” but “the price is likely between X₁ and X₂.”
And when coverage matches the intended 80%, it means the model is well-calibrated — honest about what it knows and what it doesn’t.
4. Equity markets: harder, but still promising
On equities, results were more mixed.
Microsoft and Google displayed stable predictive skill with positive returns.
Apple, on the other hand, showed under-coverage — the model was too confident and got punished for it.
That’s not necessarily failure; it’s feedback.
Equity prices are shaped by corporate events, earnings, and fundamentals — elements that pure price history can’t fully encode.
These results confirm that for equities, adding richer context (indicators, fundamentals, news sentiment) could materially improve performance.
5. Quantitative intuition: structure, not clairvoyance
No model can see the future. But a good one can tilt probabilities slightly in your favor.
The model’s consistent directional accuracy — well above random chance — means it’s capturing statistical edges embedded in the flow of prices.
Those edges, when combined with proper portfolio management and transaction cost modeling, can evolve into practical signals.
The key isn’t perfection — it’s repeatable advantage under uncertainty.
6. A foundation for adaptive forecasting
This backtest shows that the system can act as a foundation model for markets:
It generalizes across assets and sectors.
It quantifies uncertainty instead of hiding it.
It learns structure directly from time itself.
As we refine calibration and integrate richer data sources, we’re moving toward a forecasting engine that’s transparent, data-driven, and continuously improving — not a black box of predictions, but a measurable intelligence for understanding market behavior.
In short:
The model doesn’t just guess prices — it learns patterns, expresses uncertainty, and adapts to change.
That’s the difference between speculation and signal.
Join the Discussion — and Get Weekly Forecasts
If you’d like to:
See the code I used to run these backtests (including the transformer forecasting loop, metrics, and plotting functions),
Or request new backtests for other assets — whether it’s Tesla, NVIDIA, or emerging cryptos like Avalanche or Cardano,
👉 Leave a comment below and tell me what you’d like to explore next. I read every one.
And if you want to follow these forecasts as they evolve — with fresh weekly predictions, updated backtests, and transparent performance tracking —
📈 Subscribe to Market Price Predictions to get them directly in your inbox every week.
Disclaimers
This publication is for research and education only and not financial advice. Markets carry risk; past backtest results don’t guarantee future performance.
Sources & Notes
Time-series transformers & multi-horizon forecasting: Temporal Fusion Transformer. (arXiv)
Time-series foundation modeling & tokenization: Amazon’s Chronos. (Amazon Science)
Rolling/forward-origin evaluation for time series: Hyndman, Forecasting: Principles and Practice. (OTexts)
Quantile/interval forecasting & coverage: skforecast guides. (Skforecast)
Backtest overfitting cautions: Bailey et al. (davidhbailey.com)